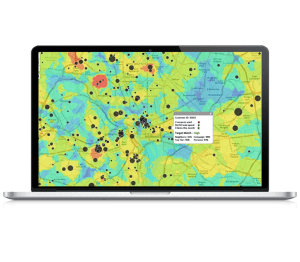
The Integration of Qlik and ArcGIS will show you…

1. Where things happen
Drag and drop your spreadsheet data onto a map for an instant Eureka moment. Visualise your data with Qlik to see where things are happening – much easier than trawling through hundreds of rows and columns of data.
2. Why they happen
Add more data onto your interactive map to understand why things happen. Turn layers on and off and explore your data to find hidden patterns and relationships with Qlik technology.
3. What action to take
Make more informed decisions based on your location data. Try some of the spatial analysis tools to discover new insights. For example, “Where is the best place to advertise my product?†“Who can access my store within a 15 minute drive?â€.
Visit us at the ESRI UK Annual Conference 2016 on 17th May, for more information click below:


