Graph Databases Can Transform Your Applications
Drive value by revolutionising your legacy line of business (LOB) applications
Creating new line of business applications that encompass a graph database, that also extends the data model to overlay existing data, to create a data fabric of a core business process or function, can lead to demonstrable operational efficiencies and savings. As such, the new age of digital transformation will adopt graph-based solutions as part of an hyperautomation strategy.
NoSQL and Graph databases have been defined and honed over the last 20 years, having been spawned from hyper-scale platform vendor solutions. They needed to create a data fabric that could make sense of vast quantities of data. Due to lack of standards the technology had been slow to be adopted in the mainstream line of business application market, having mainly been used by data scientists and in advanced web/seo use cases. Google for example uses graph schema to make sense of every web page for search and other services. Standards are now becoming more common such as GQL Oracle’s PGQL and others.
Today’s top decision-makers such as Chief Operating Officers (COOs) and Chief Data Officers (CDOs) don’t just need to manage applications with larger volumes of data – they need to generate actionable insights and automate workflow from their existing, often siloed, data. In this case, the complex often bidirectional relationships or associations between data points matter as much as, if not more than, the individual points themselves. Emulating how the human mind works when decision making.
To paraphrase Seth Godin, businesses need to stop merely collecting data points, and start connecting them. In other words, the relationships between data points matter almost more than the individual points themselves.
In order to leverage complex data relationships or associations, organizations need a database technology that stores relationship information natively (as a first-class entity). That technology is a graph database. A graph is a mathematical representation of objects (or entities or nodes) and their relationships (or edges).
Legacy relational database management systems (RDBMS) are poor at handling data such relationships. Due to their rigid schemas, it makes it difficult to add different connections or adapt to new business requirements. Just one of the reasons why organizations create data warehouses to address this need. Not realising that the problem simply becomes more complex and today we are seeing many organizations replace data warehouses with next-generation data warehouses, perpetuating the problem.
Graph databases resolve these issues at source, effectively storing data relationships, scale as required, and flexible when expanding a data model or conforming to changing business needs, meaning that if deployed as part of a core line of business application there is no need for secondary data storage. Giving graph-based solutions the ability to be disruptive as well as being a lean technology and becoming the source for automated decision support or active intelligence capability, Smarter BI.
We all want to make better decisions from our data, with graph you can
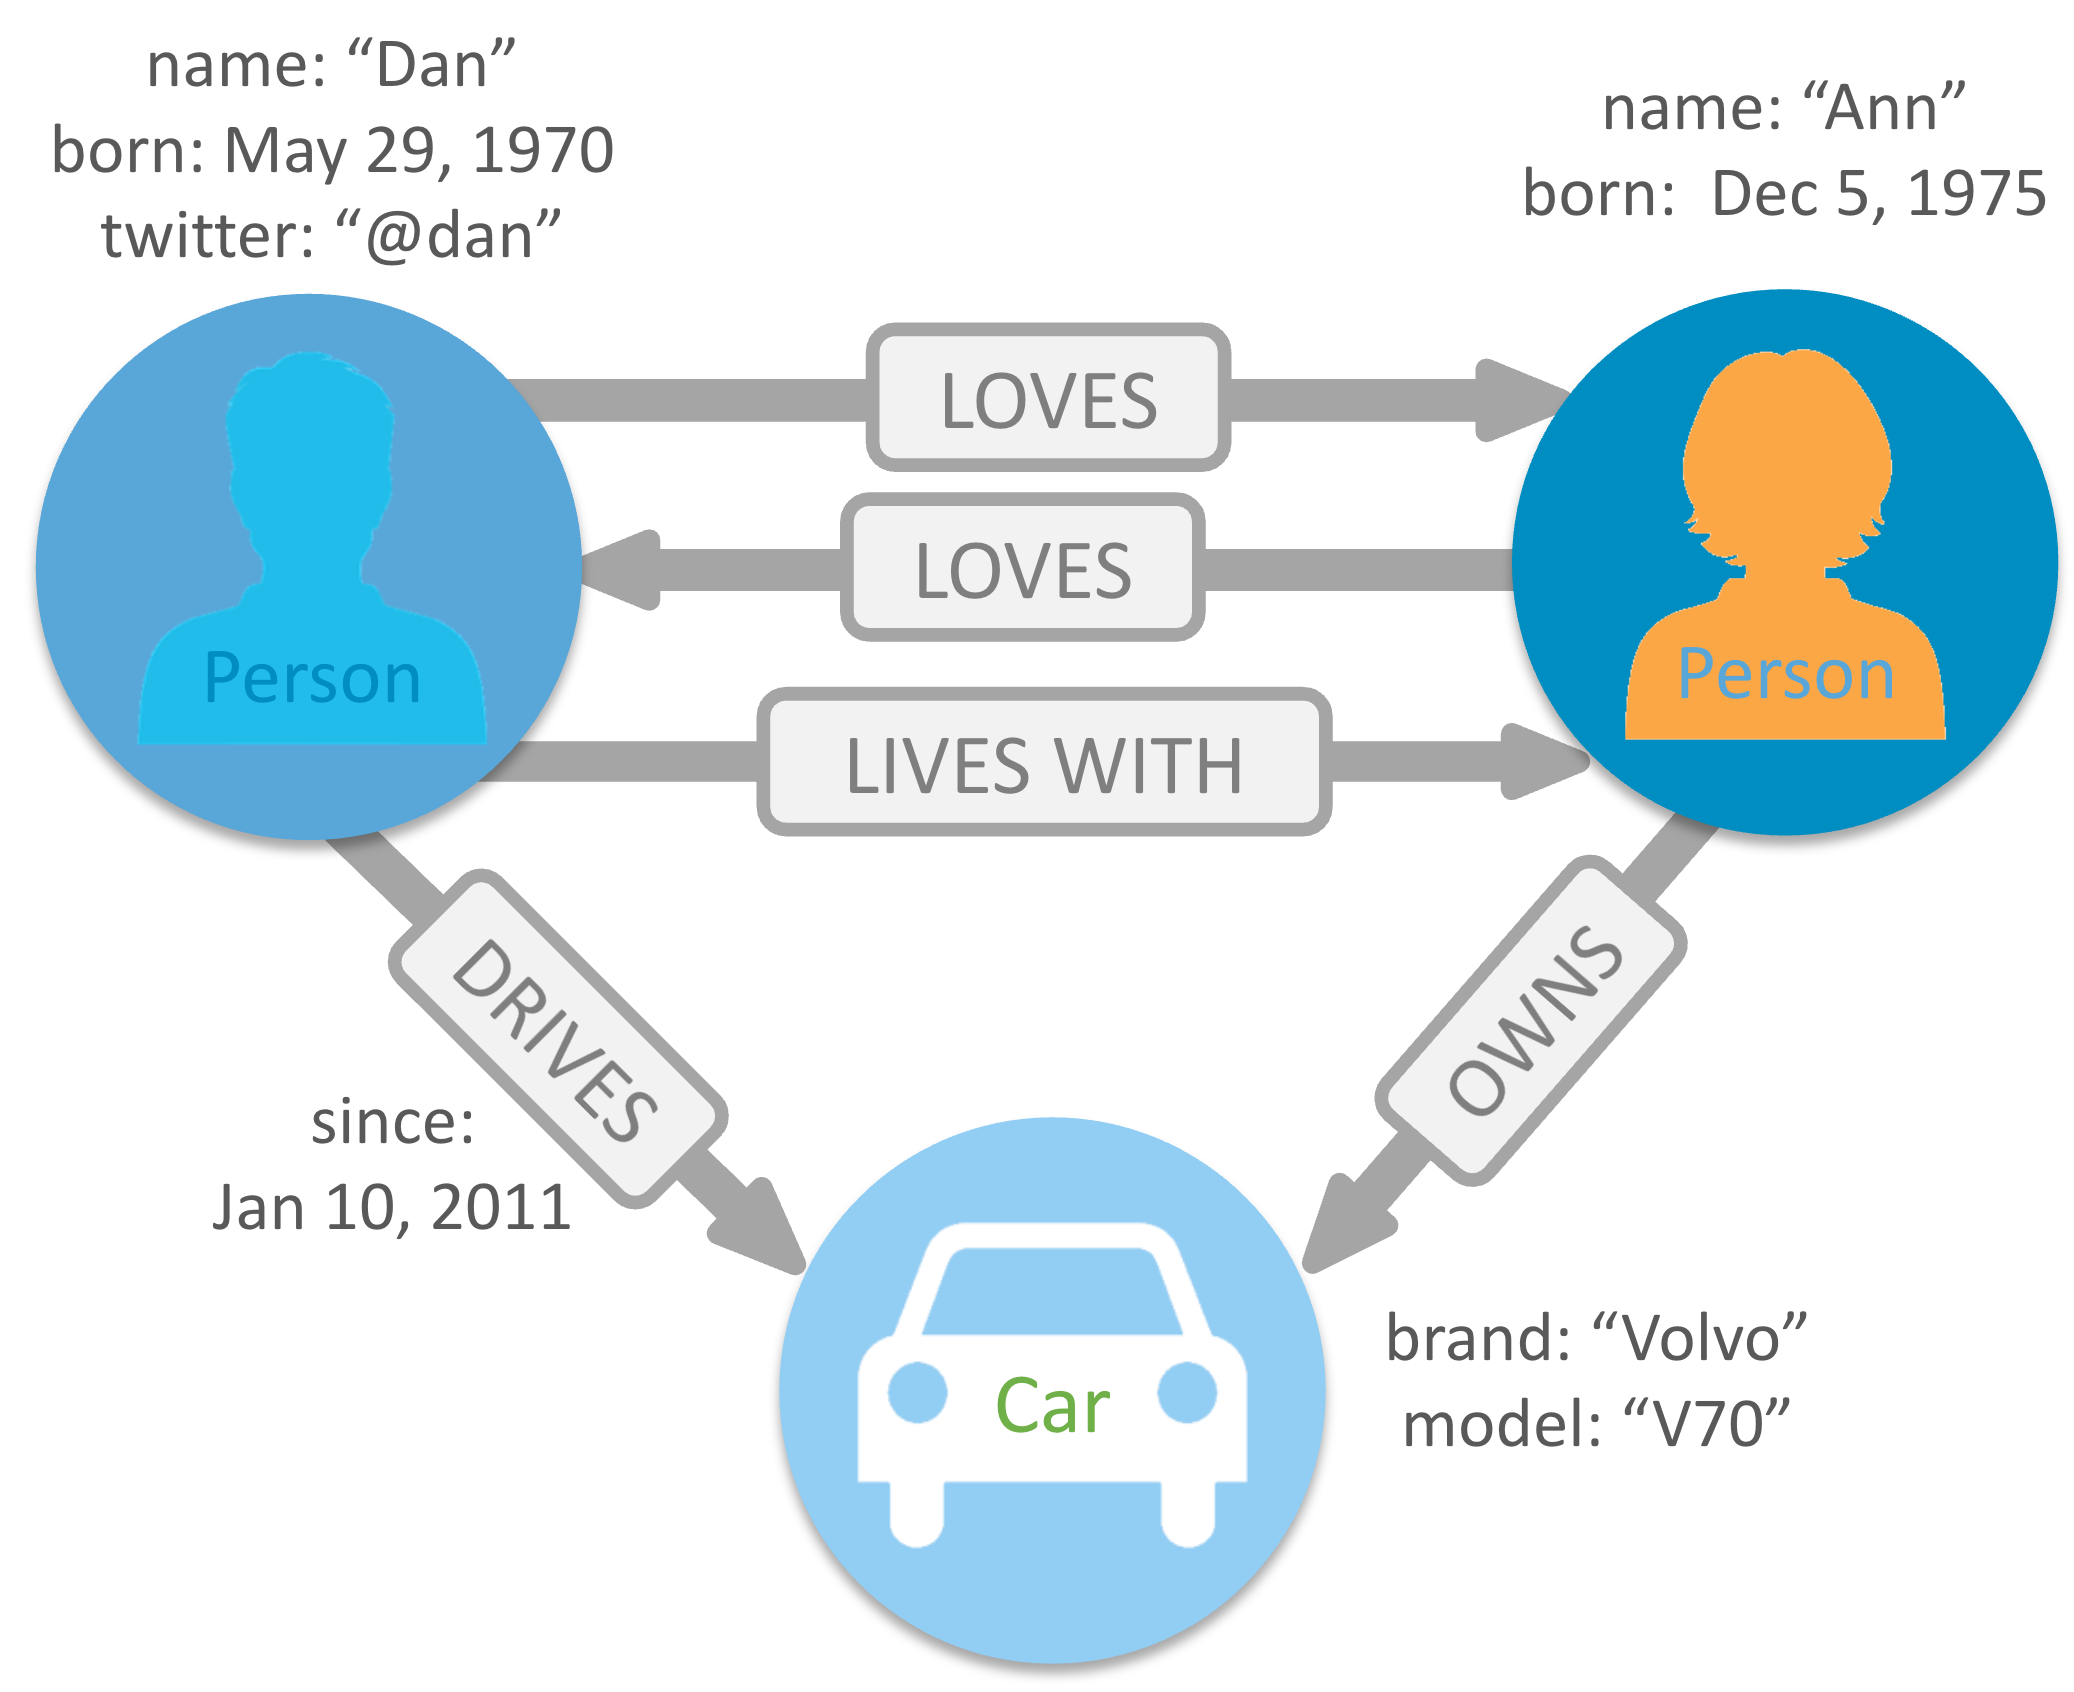
Having data that is relevant which can be enriched (eg with Doorda) and overlayed onto other source data to build a data fabric that will scale, giving decision-makers an approach to make better decisions with data. Further, the data can be viewed from multiple perspectives allowing the right decisions to be made based on all the facts. See image below from Neo4j which aptly describes the concepts in a simple image.
Graph, Digital Twin and Enterprise Performance
Given the multidimensional capability of graph technology, it is logical to use the capability to build business applications that more aptly reflect the nature of the processes that it is to support. That is to say, how the data is stored in effect becomes the digital twin of the process. This means that from a process engineering perspective, and enterprise process performance perspective, you only need optimize once, given the inherent flexibility of Graph.
As a result of graph adoption, there are already great case studies that depict the use of graph-based solutions. Similar to all technology projects there has to be a business case to adopt graph-based solutions. The key benefit is obvious, lower cost (Neo4J Graph for example is open source), however currently the main challenges are competing for data scientist time and or skills/resource-shortage, a constraint when AI/Machine Learning projects take precedence for example, and time to execute.
Differentia Consulting has recognised the particular skills shortage and cost challenge for digital transformation of this nature and has partnered with organisations such as Tangent Works to bring Instant Machine Learning for forecasting and anomaly detection, and Cyferd for its SaaS-based Graph-centric digital transformation no code Application Platform, with neither having a dependency on data scientists.
By connecting their data, organisations can generate new insights and unlock new business opportunities.
Example Graph Use Cases
Below are examples of where primarily data scientists have adopted graphs to deploy solutions that address problems.
As of 2022 no-code graph SaaS application-platform providers such as Cyferd that offer industry and process-based solutions, as a service, will we predict accelerate both rate of adoption and significant growth in use cases. We see cyber, regulatory, and net-zero compliance use cases leading the charge, where the need outstrips the availability of capability to deliver solutions manually.
TigerGraph’s proven technology supports applications for:
- Fraud detection
- Customer 360, (C360)
- MDM
- IoT
- AI and machine learning
Making sense of ever-changing big data, and is used by customers including Intuit, Jaguar Land Rover, UnitedHealth Group, and Xandr (a division of AT&T.
Connecting static data silos into meaningful-rich, enterprisewide knowledge graphs
- Stardog (which claims a 320% ROI on its platform) helps organisations connect their data silos into meaning-rich, enterprisewide knowledge graphs, and data scientists can become both more efficient and more effective as a result.
Role Based Security Models across multiple systems.
Money Laundering
Social Media Analysis
Incorporate and act on valuable IoT data
5 Real-Time Use Cases for Graph databases (Neo 4J) + Video
- 1 Fraud
- 2 Real-Time Recommendation Engines
- 3 Master Data Management Solutions
- 4 Empowering Network and IT Operations
- 5 Identity and Access Management
Further Reading
What is a Graph Database – Oracle
Graph v Relational Database – Memgraph 2021
Graph Databases for Beginners ebook – Neo4J
Practitioners Guide to Graph and other updates – DataStax
Why Graph Technology is the Future – Neo4J 2018
Graph Databases on AWS – Amazon Neptune
Graph Database – Wikipedia
Parallel Graph Database – TigerGraph
Graph Use Cases – 6point6
Why You Should use Graph Databases – Infoworld 2018
Graph Databases for MDM – TDWI 2017 (Editors Note: Please read in context of pre-cloud hyper scale vendors)
